Thursday, February 24, 2011

Tsunami essay

Tsunamis – The devastating waves
By: Teodora Milenkovic 7B
February 25th, 2011
Mrs. Medenica, Science

Tsunamis are devastating waves that can be lethal for many people, and are very destructive and dangerous. A tsunami is mostly described as a tidal wave that is caused by the movement of the Earth’s plates (an earthquake), under the Earth’s crust. Every earthquake has an epicenter, a point on the surface right above the earthquake’s focus, as well as a hypocenter, the exact point of the fault movement. Once seismic primary, secondary and surface waves start traveling underwater, they cause the creation of a wave that reaches great heights once it hits the shore. However, in the open sea, tsunami is very low, just around one meter. This is because it hasn’t gathered a lot of energy yet, and hasn’t grown a lot. Tsunamis are rarely felt by scuba-divers and ships in the open ocean. As the tsunami travels it can grow to a width of about 100 kilometers, and it can be as high as 30 meters! Once it comes to the shore, the tsunami has no more water to travel through, so it collapses, stopping many lives, and ruining the economy, culture and other important factors of one country. Before a tsunami happens, the water may move away from the shore for a little while, exposing the floor of the ocean. Once the tsunami hits, the first wave is usually not the largest one. Waves keep on coming every ten to sixty minutes, getting bigger and bigger. Tsunami is a natural disaster that has frightened many people, and that would most definitely really scare me if I was to experience it, and survive it.

Tsunamis happen all over the world, in major oceans, such as the Pacific, Atlantic, Indian and others. Around 70% of our planet is made out of water. However, there is an area where tsunamis seem to happen over and over again, and that is the Ring of Fire. The Ring of Fire is an area in the Pacific Ocean located around Australia, the east part of the Eurasian plate, as well as the West Coast of the Americas. This part of the ocean is around 40, 000 kilometers long. One of the deadliest tsunamis ever happened in Indonesia in 2004, and it completely destroyed a large part of that country. This is not very surprising, since Indonesia lies in between the Ring of Fire. Most earthquakes occur along the Ring of Fire because that is where most of the fault lines are, and where tectonic boundaries are located. Apart from the earthquakes, and tsunamis, many volcanic eruptions occur along the Ring of Fire, as well.
The most recent tsunamis happened in Mentawai, Indonesia in October of 2010, and on the Bonin Islands, in December 2010. The tsunami in Mentawai was caused by an earthquake that had the magnitude of around 7.7. That is extremely high, and this tsunami killed around 108 people, as well as causing around 500 to go missing. The tsunami that happened on the Bonin Islands, Japan, was cause by an earthquake that had the magnitude of 7.4, but the number of casualties is unknown.

Since tsunamis happen quite often, scientists found different ways to predict tsunamis, and help the people of the endangered area evacuate before it is too late. All tsunami warning systems consist of two components that are equally important. The first part is the actual sensors that detect the seismic activity, and the other component is the infrastructure of the alarms and communications, to warn the people of endangered areas that a tsunami is approaching. One of the most famous ways of seeing whether a tsunami is coming or not is by satellites, that can take an accurate picture of how far the tsunami is, and how long will it take until it reaches the shore. Then, the satellites can send the information to different tsunami warning facilities around the globe, including the PTWC, for the Pacific Ocean, and the Coordination Group for the Tsunami Early Warning and Mitigation System in the North Eastern Atlantic, the Mediterranean and connected Seas. Another warning system, that I think scientists should work on making, is a sensor-based system that would act like certain animals due. Some animals (like elephants) can detect seismic waves coming from the ground. Certain species of animals can hear sound waves outside of human range of hearing, and therefore can sense that something is wrong. In the 2004 tsunami in Indonesia, elephants went for the hills once they detected the seismic waves, because they knew that something abnormal is happening. Another type of warning system consists of The Regional Warning System, and The International Warning System. The Regional Warning System predicts whether there is going to be a tsunami by gathering the seismic information in that area, or place. Then, they warn the citizens through sirens. However, this is not always affective, because, just like in weather forecasts, there are a lot of fake alarms. The International Warning System gathers the information about seismic activity from other countries, to see whether a big tsunami is approaching.

Besides the many warning systems that are being developed right now, tsunamis cannot, unfortunately, be stopped and they continue ruining peoples’ homes, and killing their families. Most of the effects of tsunamis are long-lasting, and cannot be repaired over night. Besides the physical look of the cities that are hit by tsunamis, many more factors get very damaged, or even ruined in extreme cases. The tourism of the countries affected suffers terribly, because tourists do not want to come to a beach, and be afraid that a tsunami might kill them. They will choose to go to a safer place, where the risk of a tsunami is lower. Tsunami affects the overall health of the people, as well. From the water that the tsunami brings to the shore, many bacteria create, because of the humidity. This results in many skin-related illnesses, and sometimes even epidemics. The economy of the country is affected, as well, because the tsunami ruins much of it’s’ agriculture and infrastructure. Part of the culture gets wiped out sometimes, when historical artifacts and buildings collapse under tsunami’s pressure.

In conclusion, I can state that tsunamis are extremely dangerous, mostly because of the enrgy they carry with them, and the way they release that energy. One tsunami can have the power of even 30,000 atomic bombs. If it takes one atomic bomb to destroy a whole city, 30,000 bombs could surely wipe out a few countries. In the near future, I hope that scientists will also start coming up with more revolutionary ideas of how we stop tsunamis, or, at least, how we can make them less powerful. I also hope that they will continue working on the houses that can withstand a tsunami. If they keep improving this invention, less people will be left on the streets after the natural disaster.


A tsunami approaching the shore.


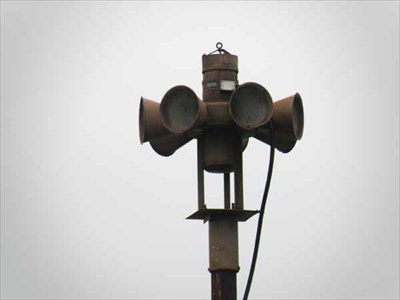
One of the sirens used to inform people about a potential incoming tsunami.


Monday, February 21, 2011

The seismograph lab :)

For this lab, we had to make our own seismograph, that would actually work. I didn't really have a guiding question, I just wanted to make a seismograph that worked, and that would actually record some findings about seismic waves. So, I came up with a simple question, that was interesting to investigate, and that is: "Why is is important for the pen of the seismograph to be completely stable?". My hypothesis was that it needs to be stable for the findings to be clearer, and for the information to be more accurate, but I didn't think it played a big role in the overall productivity of the seismograph. Check out the sketch of the first design we thought of.
My partner was Sophie, but she was absent while I did the modifications, so Maria finished the experiment with me.

However, straight after we finished testing this type of seismograph, we realized that it wouldn't work, because, when the pen is dangling, it is not giving the proper results, because it is just writing all over the paper, which is supposed to be the only moving part of the seismograph. Weights are also placed at the wrong place, since they are just dangling, causing the pen to be unstable. We didn't knock the nail very well, and the two boards were a little bit crooked, and we realized that, that also severely affected the performance of the seismograph, so we decided to do something about that, too.
This is our new seismograph, with much of the corrections made. The chair is holding up the board, since it is very unstable (however, for our final version of the seismograph, we removed the boards all together, because we realized that we don't really need them). We moved the pen down, and we attached it to the chair, with two wires, and two strings. We attached the weights to the strings, with tape. Finally, the pen was stable enough, and it gave accurate results, once we moved the book that was under the paper. Underneath you can find the pictures of our final product.


The procedure
  1. Firstly, we put boards together with a few nails. Then, with a string, we hanged the pen (with two weights).
  2. We put a chair under the top board, to  keep it in place, and to prevent it from moving. We also put my pencil case under the board, to keep it even more stable.
  3. To keep the pen from moving, and dangling, we put two strings and two iron wires around the pen, and around the chair.
  4. We put the paper, under the pen, and moved the book that was placed under the paper, and that was supposed to represent the seismic activity. the faster you move the book, the stronger the power of the "earthquake" is. 
Based on your tests, decide how you could improve the design of you seismograph.
As I said above, we didn't have a very stable pen, and our results weren't very clear. The pen kept shaking, and going all over the paper. If I were to do this lab again, I would make the pen more stable in the beginning, so that I wouldn't have to waste time making modifications that could have been avoided.
Designing a Solution: How did you incorporate what you learned in Part 1 into your seismograph design in Part 2?
While I did Part 1 (Research and Investigation), I learned that you have to make the pen very stable, and the pen cannot move at all. Another thing I learned is that if you make the seismograph too complicated, you will get lost, and not have enough time to accomplish everything you wanted. So, you had to think about your design in terms of how much time you had, and what materials you were limited to.
Working with Design Constraints: What limitations did factors such as gravity, materials, costs,time, or other factors place on the design and functions of your seismograph? How did you solve these problems?
Out of the above, there were two limitations that we had. Firstly, we didn't have a lot of materials we could use, so most of the planning of the experiment actually consisted of improvising, and using what we had around us in the classroom to make a severely sufficient seismograph. Another obstacle we had was time. We had to make the seismograph over the course of 3 lessons, and that was challenging at times, because you got stressed, and you made pointless mistakes on the seismograph (like knocking the nails wrongly, and making the boards tilted).
Evaluation the Impact on Society: Why is it important for scientists around the world to have access to accurate and durable seismograph?
Seismographs are very important for every country, and they can save one country's economy, government, many lives, as well as important cultural artifacts and buildings. You should better be safe then sorry. Seismographs can give people the opportunity to save their lives, and evacuate themselves. By knowing the power of the earthquake, people have the ability to prepare themselves, and know what to bring when evacuated. 

My conclusion is that the pen needs to be stable in order for the seismograph to work, at all. Seismograph is a device used to detect earthquakes, by monitoring the arrival times of primary and secondary waves. When the ground moves, and the waves come, the paper moves, and it's movement is marked by the pen. All the high points on the paper, are where the earthquake was the strongest. All the lower points, or straight lines, are when the earthquake's strength wasn't as big. Underneath you can see the "seismic activity" that our seismograph recorded. :)


Tuesday, February 8, 2011

Finding the Epicenter lab

Hypothesis
My hypothesis is that the epicenter will be where all the three circles meet, because that point will show where all the seismic waves actually started. Right now, I really have no idea where the earthquake might be, but I am predicting it will be somewhere around Tennesse, Kentucky, or Alabama.
1. Observe the three circles you have drawn. Where is the earthquake's epicenter?
The earthquake's epicenter is in Tennesse. I can conclude this because all the circles, representing seismic waves, meet in Tennesse. The seismic waves were last located in Denver, Colorado, because the difference in P and S wave arrival times was the biggest (2 minutes 40 seconds). This Tennesse earthquake affected almost the whole U.S., except the west part (North Carolina, South Carolina, Georgia, New York, Maine, etc).
2. Which city on the map is closest to the earthquake's epicenter? How far, in kilometers, is this city from the epicenter?
I think that the city closest to the epicenter is Nashville, Tennesse. Nashville is a fairly big city, and I guess that it was affected a lot by the earthquake. Nashville is around 100 kilometers from the epicenter, which is VERY close. It must have been a devastating earthquake for the citizens of Nashville :(. I find it really strange that the earthquake is in Tennesse, though. There are no plate tectonic boundaries near Tennesse, so I am really wondering what caused the earthquake.
3. In which of the three cities listed in the data table would sesismographs detect the earthquake first? Last?
I think that the seismographs would first detect the earthquake in Chicago, Illinois. I think this because the primary and secondary waves would reach this city first, since it is the closest to the epicenter of the earthquake. The last place the earthquake would be detected is Denver, Colorado, and the difference between the primary and the secondary waves is the largest. The "middle" city would be Houston, Texas.
4. About how far from San Francisco is the epicenter that you found? What would be the difference between P and S arrival times for a recording station in San Francisco?
San Francisco is around 3, 200 kilometers from the epicenter. I measured this by using a scaled map, and a compass. I used the graph that we were given to figure out that if it there is 3, 200 kilometers from San Francisco to the epicenter, the difference between the arrival times of primary and secondary waves is around 4 minutes 40 seconds.
5. What happens to the difference between the P and S waves arrival times as the distance from the earthquake increases?
As the distance from the earthquake gets bigger, the difference between arrival times of primary and secondary waves grows, as well. You can see this from several examples. San Francisco is the furthest away from the epicenter, and it has the biggest difference between the arrival times of the two types of waves.
6. Review the procedure you followed in this lab and then anser the following question. When you are trying to locate an epicenter, why is it necessary to know the distance from the epicenter for at least three recording stations?
It is necessary for several reasons. If you do not know the distance from the place to the epicenter, then you cannot use the graph (oh which I took a picture below) to figure out the difference between the arrival times of primary and secondary waves. Also, when you are detecting where did the seismic waves go, and where they meet, you need more then one circle, to be exactly sure. If you have less then two circles, your data is probably not that accurate.
More to explore
Honestly, I think that there wouldn't be a lot of epicenters in this area, and that this earthquake in Tennesse is very rare. Earthquakes are very common on the boundary of the North American plate, and the Pacific plate. This is on the West Coast, or California. When earthquakes occur here, some of the very strong ones could potentially affect the places where this earthquakes occur, because seismic waves travel through and on the ground. I found it very weird that the epicenter was in Tennesse, very near Nashville o.O. On the earthquake rick map it shows that Tennesse has lower risks of earthquakes, but earthquakes can still occur.
A recent earthquake happened in Kraljevo. The magnitude of this earthquake was 5.3, and even though this is not very high, the effects were devastating. Houses were ruined, and people were without homes. The government had to build small, plastic and metal houses, to keep the people warm in the winter, and enable survival. This earthquake happened around 1:56 a.m., and it was felt as far as Belgrade!